 I’m a regular user of a few social media tools (e.g. Facebook and LinkedIn).
As such, I often see the (well-intended) sharing of articles about someone passionately scooping plastic out of our oceans – perhaps with a newly invented contraption – and then lots of people (understandably) pile in with a ‘like’ of what they see. Yep, I often press ‘like’ too.
…yet I get really frustrated with the (seemingly weekly) sharing of such apparent ‘good news stories’ – sure, they appear highly desirable, but I see them as a ‘thimble of goodness within a sea of chaos’.
There’s so much more that we don’t see/ question/ understand/ shout/ do something about. I’d love to see a systemic view – of the problem, and the interventions…and their effects.
What on earth am I talking about? Well, I’m no expert but what follows is my layperson’s (current) thinking. I’d love the real experts to take it on and give us all a regular (i.e. dynamic) and highly visible (i.e. transparent) dose of whole-system reality.
A close-up look:
Here’s a diagram of our oceans – I know it’s not quite accurate…. bear with me…it’s a simplified view! 😊

If you want to get a bit theoretical about it then Professor Jay Forrester, in his early work on System Dynamics, wrote about ‘levels’ and ‘rates’2:
“The level (or state) variables describe the condition of the system at a particular point in time.” i.e. the level (or amount) of plastic in our oceans as of today. I usually visualise a bucket and the current level of its contents.
The value of a level at the start of operation is called the “initial condition” …which, for the subject of this post, would have been zero plastic in our oceans, because it doesn’t occur naturally.
“The rate (action) variables tell how fast the levels are changing” and “…are defined by ‘rate equations’…that describe action in a system”. In short, we can think of taps into our bucket and scoops (or perhaps drains) out of our bucket. Each of these are rate variables.
“The level variables accumulate the results of actions within the system.” i.e. the current level of plastic in our oceans will (rather obviously) be:
The initial condition (zero in this case);
Plus: the accumulation of all the plastic that we’ve ever put into it;
Minus: the accumulation of any plastic that we’ve taken out.
“A level variable is computed by the change, due to rate variables, that alters the previous value of the level.” i.e. whether our level of plastic in the ocean is going up, staying the same or coming down is determined by ALL the rates into and out of the ocean. So, yes, we might have made a wonderful scoop BUT if we’ve also opened up the tap some more (let alone closed it) then that level will still be going up! And probably rapidly ☹.
To summarise the obvious: There’s a HUGE gushing tap of plastic being dumped into our oceans…and a tiny, irregular scoop of plastic being taken back out. That scoop represents those social media articles we so like.
Why the monumental discrepancy between our tap and our scoop? Well, we’ve got nearly 8 billion (and increasing) people devouring plastic daily, combined with ever-widening uses of plastics3 – we’ll never have a scoop that can cope with that!
The other bit of interest to me in my simple diagram is what happens after the scoop. Great, we’ve collected tons of plastic…but then what? It’s still plastic and will be for hundreds, if not thousands, of years.
And it’s at this point you’d say to me “Don’t be stupid Steve! The collected plastic gets recycled”.
But does it? And even more relevant, does this really assist?
Looking a bit wider:
Here’s my 2nd ‘wider system view’ of plastics diagram:
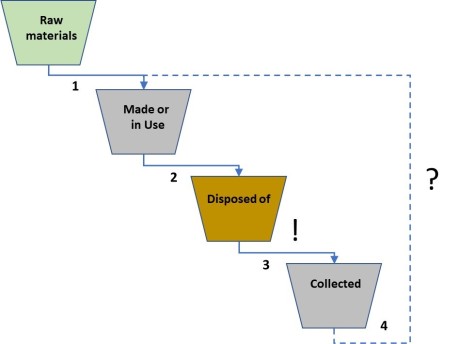
Now I’ve got four level variables (or, in simple terms, buckets) and four rate variables (the drains from one, and taps into another, bucket)
The raw materials represent the necessary ingredients found on planet earth for the making of plastic (which I understand to be mainly oil). We act in our daily lives (particularly with regards to plastics) as if these raw materials are non-exhaustible…which clearly isn’t the case.
I’ve combined made and in use into one bucket to represent the productive plastic in existence. It’s worth noting that there is an array of different kinds of plastics, and most plastic will go through a journey from its initial conversion into plastic pellets, through its forming into plastic objects, to its assembly as part of a specific product and then to its sale and consumption. This can be a short or long time-cycle (think ‘single use’ plastic vs. plastic used in, say, a car).
I’ve coloured my disposed of bucket brown to represent the fact that such plastic can be found all over the place (not just in our oceans). Most of it is likely piled up on, or buried under, land.
That all looks simple doesn’t it. Surely we just need to collect it (increase rate 3) and then feed it back round (increase rate 4). A lovely closed loop. However…
Adding some of the tricky details
Here’s my 3rd diagram:

I’ll take each of the four sub-systems, starting at collected and working my way backwards:
Collected: Much of what we, as consumers of plastic, see (and therefore think about) in terms of recycling is only the front-end collection piece. We can (rightly) feel good about having gathered it all up…but we have very little understanding of what (if anything) happens afterwards. For example, do you know:
- what % of the plastic that you have lovingly collected is re-useable…and, more importantly, is actually re-used?
- Corollary: what is done with any plastic that is ‘rejected’ for re-use?
- how efficient is the re-cycling process? i.e. what % of your collected plastic makes it to a re-cycled state once the various processes are performed upon it (cleaning, de-stickering, de-capping, separating….)
- Corollary: what is done with any plastic that falls out of this processing?
- what can your re-useable plastic be used for? And what can’t it?
and most significantly:
- have your efforts prevented ‘virgin plastic’ from entering the system?
Disposed of: My revised diagram is showing that plastic can be responsibly disposed of, or can be discarded (anywhere and everywhere), and can then leak down the chain through the land and rivers to the oceans. There’s masses of it, everywhere!
Made or In use: There’s some really important points of note within this sub-system.
- Types of plastic: There are thousands of types of plastic, and because of this, it’s not simply a case of plastic collected and put back into the system again. Not all plastics are alike. Yes, there are some common types, but manufacturers are free to develop very specific plastics for their needs…which can then preclude it from being re-cycled (or at least currently).
- ‘Virgin plastic’: Some plastic applications require 100% brand new plastic. I understand that (much of) the food industry (currently) sits in this category.
- ‘Down-cycling’: A great deal of what we call the re-cycling of plastic is in fact ‘down-cycling’. i.e. yes, we have got plastic that we can use for something….but in many cases we can’t (or at least don’t) re-use it for its original purpose. Sure, we can make items like hard chunky plastic furniture (a common use) but is this really a good thing? Has it prevented new plastic entering the system? Do we need these down-cycled items?
A common ‘down cycling’ application that is touted as a great thing is the creation of polyester clothing…. which takes us to the thorny issue of micro fibres. Every time we wash ‘plastic fibres’, some bits come off into the water and enter our environment…and our food chain.
- Re-cycling: Even if we are re-using plastic, many such applications require it mixing with virgin plastic to do so, often in high proportions. Sure, you might be pleased that some of your collected plastic has come back round the loop, but that’s not much good if 9 times as much new plastic is required to do so4.
- Re-purposing: I often see links to video clips where plastic has been collected and then made into ‘art’. Yes, the result might look very nice (and desirable) but all we’ve done is found a place to sequester the plastic for a few years! Such repurposing has no effect on the gushing tap.
Raw materials: Every time we use raw materials to make plastic (i.e. the red flows on my 3rd diagram) we are adding to the existing problem, no matter how much is collected and returned. Put simply, we are created more plastic that will go somewhere on this earth.
The only sure way to close the loop would be to return the plastic to its original state – the green flow on my final diagram. Can this (truly) be done? That’s where, as a lay person looking at the whole system, I frustratingly admit that I don’t know. I’ve seen videos of people running small scale experiments on this, but I’ve got no idea if this is being (or will be) ‘industrialised’.
There’s probably nothing in the above that you didn’t already know but, because it’s never put to us in one glorious picture…we are good at compartmentalising it all away (hitting ‘like’ on a feel good article) and getting on with our (plastic consuming) lives.
The Whole system
We, the citizens of this world should want to know about the whole system. Sure, that scoop collecting our detritus out of the ocean is (currently) necessary but it’s soooo not sufficient.
Personally, I want my government5 to show us (i.e. everyone) the ‘warts and all’ picture. Transparency of what’s happening (i.e. feedback) is required – without it we aren’t in a position to properly respond.
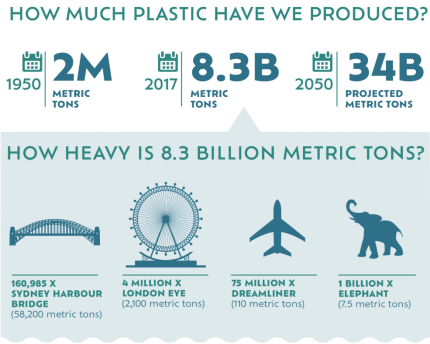
For your information: Here’s a diagram from a 2017 research study into the amount of plastic ever produced and where it currently resides…

Some notes:
- The figures in the diagram represent millions of metric tons (Mt). i.e. 8,300 Mt is 8,300,000,000 tons.
- If, like me, you don’t really understand what a ton looks/feels like (I’ve never picked one up) then imagine a 1 kg bag of sugar. 8,300,000,000 tons is 8,300,000,000,000 kg.
- I’ve not really helped you much there…because that’s unimaginable!!!6
- This plastic only started to be produced in scale from the 1950s…we’ve achieved this mess in as little as 70 years….and it continues to accelerate.
- 60% of all plastic ever produced is ‘out there’, discarded
- Only around 7% has been recycled…but this hasn’t stopped new plastic entering the system.
The simple message within this post is for us to set out, look at, and continue to focus on, the whole.
Addendum
This post was about plastic on our planet but the idea of ‘seeing the system’ rather than ‘focusing on one sub-system within’ is applicable to all complex, dynamic systems.
Turning to models: Forrester defined a model as “…a substitute for an object or system” and went on to write that:
“any set of rules and relationships that describe something is a model of that thing. In this sense, all of our thinking depends on models.”
However, “There are several major defects in mental models of dynamic systems that can be alleviated (not eliminated) by converting from mental models to models represented by explicit statements in the form of flow diagrams.”
Further, “…because we cannot mentally manage all the facets of a complex system at one time, we tend to break the system into pieces and draw conclusions separately from the sub-systems. Such fragmentation fails to show how the sub-systems interact.”
See, and work on, the whole.
Footnotes
1. Health: This post has totally ignored any ill-health effects on humans (and other life forms) from using plastic. That’s a far bigger topic, and one that I don’t know (enough) about to comment on.
2. A Book: I don’t know if it’s currently in reprint but the early work on this is ‘Principles of Systems’. I bought it years ago. It contains Forrester’s original undergraduate course on System Dynamics.
Note: Modern system dynamics seems to talk about stocks and flows in place of levels and rates. Different words, same thing.
3. Plastic use: If you did a ‘plastic usage’ audit for one day of your life…then it’s scary what you’d find, even if you are attempting to be a responsible citizen. When it comes to plastic, we often don’t get a choice!
4. Mixing: here’s a short video clip of the making of plastic bottles. It shows a ratio of 10% recycled plastic to 90% virgin. Not much ‘closed loop’ recycling going on there! I don’t know how current or standard this video is…but you get the point. The narrator explains that “Recycled plastic loses some of its physical properties, so the recycled content can’t exceed 10%”.
5. Government …because I don’t suppose that the plastic producers will do this, at least not objectively.
6. Unimaginable: Some people have tried creating some info-graphics to assist. Here’s one:

Can I suggest a rather interesting book: Robinson, S., and Moraes Robinson, M., (2014) Holonomics: business where people and planet matter. Floris Books, 255 pp.
They make some interesting distinctions between mechanistic and integral systems thinking – something that has bothered me for a long time. I got a lot out of it. Their thrust is much broader and more fundamental than the title might lead you to believe.
LikeLike
Thanks Kelvyn. That book is on my ‘to buy at some point’ list 🙂
FYI: You may already have read it but Russell Ackoff wrote an awesome essay explaining and contrasting mechanistic, animated, social and eco systems.
LikeLike
The concept of state and rate have been around in accounting and economics for a while as “stocks” and “flows”
There is another systems thinking post written from this stocks and flows perspective to be found at
https://thesystemsthinker.com/step-by-step-stocks-and-flows-improving-the-rigor-of-your-thinking/
This post rightfully points out that the state of the oceans is a symptom of a lack of understanding by humanity that humanity is a participant in a larger system.
understanding states and rates or stocks and flows is fundamental in appreciating pollution in the context of a system.
LikeLiked by 2 people
The dynamics here (stock/flow) are a bit akin to the national debt – a perpetually increasing stock because the flow, while variable, is almost entirely in one direction.
The stock =
Total accumulated debt of a nation over time (effectively bonds held by individuals and institutions).
The flow =
The rate of change in that debt, as new bonds are issued or older bonds mature
The flow itself is a function of the gap at any given point between two other flows – monies raised via taxation vs public spending. We generally express this as an annual total (thanks accountants!), but its actually constantly changing all of the time, irrespective of government’s attempts to control it.
We only ‘deplete’ the stock of national debt as bonds mature and that sliver of the debt is ‘paid off’, but we add to it on an almost daily basis by selling more bonds to finance the public deficit (the flow). If we applied the logic of the plastic example here, we’d be celebrating every time we completed payments on an individual bond while ignoring that the overall stock is increasing inexorably and has done (in the UK) almost constantly for the last forty years.
The problem you’ve eloquently described applies to many environmental issues – we (people) cause a severe and growing problem over a time horizon longer than our (terrible) ability to see it. Then, once we do see it, we make well-meaning but essentially feeble attempts to ‘put it right’.
Similar dynamics play out in…
Various types of pollution
Deforestation
Climate Change
Extinction events
Resource depletion
…and many more. I guess it’s a challenge for policymakers to convey the scale of some of these problems without creating a narrative of fatalism and despair, which rather than acting as a catalyst, instead crushes people’s enthusiasm. And that’s just when it comes to fixing the mess we’ve made – a better (double loop?) solution might be for us to consider our environmental impact *before* we trash things, which is done in a tokenistic way in some countries, provided it doesn’t annoy big business too much.
LikeLike
Thanks for this commentary – it fits nicely…and (as per Forrester’s comments in my addendum), there’s a ‘national debt’ system diagram just asking to be drawn (and even a system dynamics model to be run) 😊.
Your comment on whether we human beings can take the depressing (yet factual) narrative is an interesting one. I guess that it’s a choice of ‘knowing that you’re driving over a cliff’ or doing so obliviously. I hope that transparency would be a good thing.
I note that Donella Meadows* advice for dealing with the ‘tragedy of the commons’ system archetype was to “educate and exhort the users, so they understand the consequences of abusing the resource, and also to restore or strengthen the missing feedback link…so each user feels the direct consequences of its abuse.” There’s a fair bit of relevance in her advice for ‘policy makers’. Further, a transparent system might not be so reliant on policy makers, because a core of people might ‘move’ for themselves….which may achieve social tipping points.
(* Meadows is one of my giants and was a student of Forrester’s)
Your final comment of “provided it doesn’t annoy big business too much” is interesting to me, and reminds me of Professor Ha-Joon Chang’s excellent book ’23 things they don’t tell you about Capitalism’…particularly his advice at the end about why he supports capitalism but not of the free-market variety.
Cheers,
Steve
LikeLike